Flower and plant market holds its ground despite economic and geopolitical uncertainty
July 10, 2026
In the second quarter of 2026, Royal FloraHolland traded fewer flowers and plants than in the same period last year. The number of items sold fell by 4.8 per cent, whilst revenue decreased by 2.7 per cent. The relatively modest decline in revenue, compared with the drop in volume, shows that pricing remained stable across many product groups.
Thomas Bugel, Chief Grower Value Management: “At a time when consumers, the trade and the retail sector are facing economic uncertainty, geopolitical tensions and fluctuating consumer confidence, the floriculture market is proving resilient. Flowers and plants remain as popular as ever, and greening our living environments is very much on the agenda as a way of combating heat stress, now that we are experiencing more and more very hot days.”
Whilst the first quarter was characterised by volume growth combined with price pressure, the second quarter presents a different market outlook. Supply declined across several product groups, whilst supply and demand became better balanced. This resulted in more stable pricing for both flowers and plants.
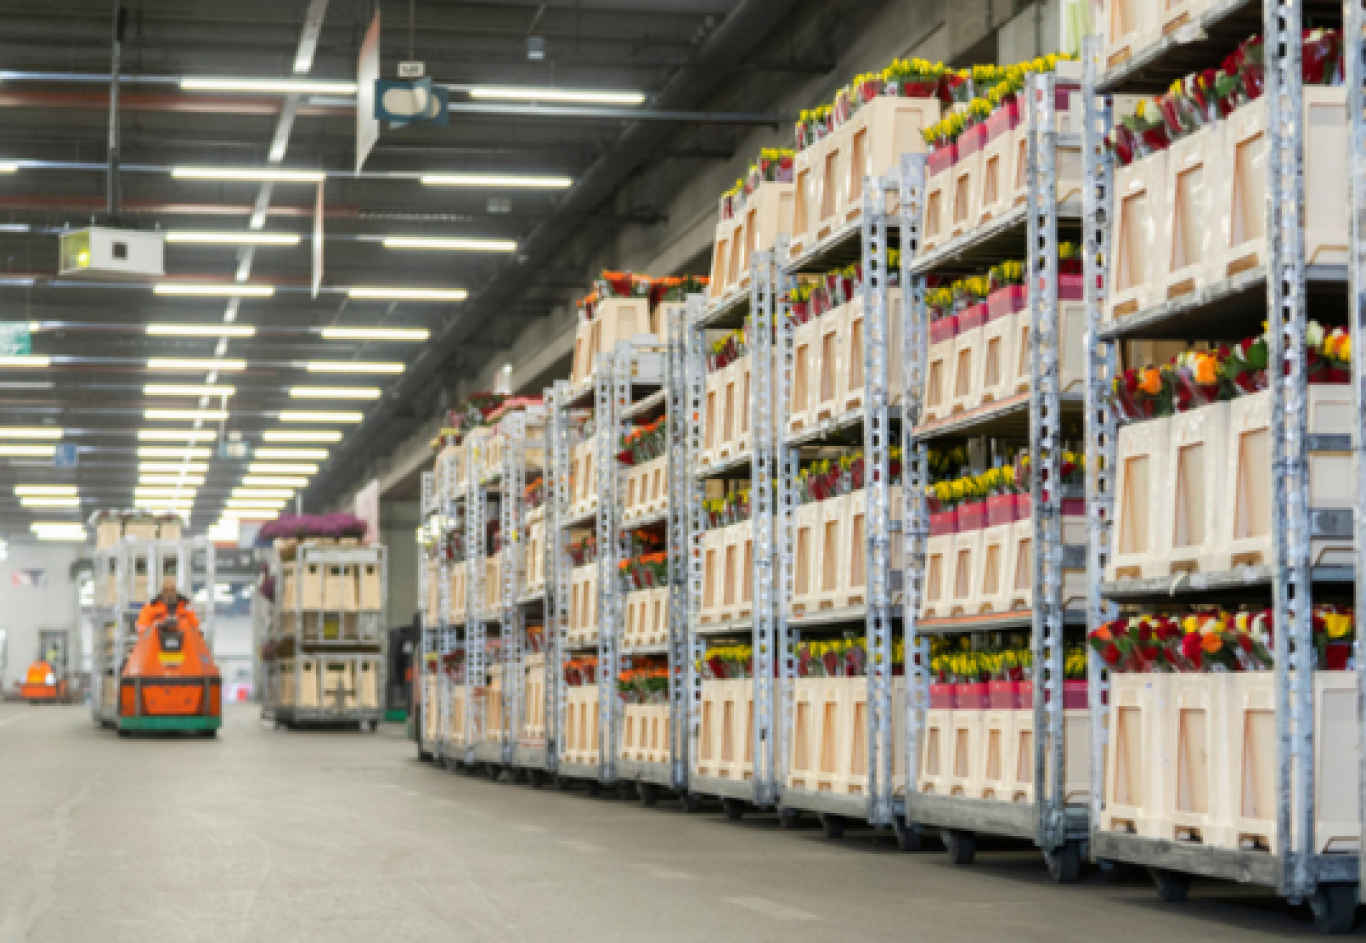
The slightly lower volumes did not lead to less work for Royal FloraHolland’s logistics team. Due to the rising level of detail buyers demand, a grower’s delivered trolley is increasingly split into several smaller transactions. As a result, there is more work per delivered trolley than before. In 2026, RFH’s logistics staff therefore handled more transactions than ever before. During the most recent peak period, the highest number of flower transactions in Aalsmeer in a single day was 102,000; in 2025, it was 93,000. That represents a 10 per cent increase.
| Q2 2026 | Change (%) |
|---|---|
| Revenue | -2,7% |
| Units sold | -4,8% |
| Price - Flowers | +2,9% |
| Price - Plants | +3,2% |
| Share - Units | Q2 2026 |
|---|---|
| Auction | 49% |
| Direct | 51% |
Cut flowers: lower volumes, but a more stable market
Within the cut-flower market, the number of stems traded fell by 4.5% in the second quarter, whilst average prices rose by just over 2.9%. Whereas the first quarter was still characterised by volume growth combined with price pressure, we are now seeing that a more limited supply across several product groups is supporting price trends.
Partly due to geopolitical tensions, the Rose and Seasonal Flowers product groups have had a challenging quarter, with lower volumes than last year, albeit at slightly higher prices. In contrast, product groups such as Chrysanthemums and eustomas grew in both volume and revenue. Revenue for Peonies also remained virtually the same as last year, despite lower supply, thanks to significantly better pricing.
| Position Q2-2026 | Cut flowers | Change in product revenues (%) | Change in units sold (%) | Average price Q2 '26 (€) | Chainge in average price Q2 '26 (%) |
|---|---|---|---|---|---|
| 1 (-) | Rosa | -10,1% | -10,5% | € 0.23 | 0,5% |
| 2 (-) | Chrysanthemum (Ind Grp) T | 3,7% | 1,8% | € 0.36 | 1,9% |
| 3 (-) | Paeonia | -0,1% | -8,9% | € 0.64 | 9,7% |
| 4 (-) | Tulipa | -8,0% | -1,2% | € 0.20 | -6,9% |
| 5 (+1) | Eustoma russellianum | 5,8% | 2,7% | € 0.80 | 3,0% |
| 6 (-1) | Lilium | -2,9% | -5,3% | € 0.74 | 2,5% |
| 7 (-) | Gerbera | 1,9% | 2,7% | € 0.18 | -0,8% |
| 8 (-) | Hydrangea | 7,3% | 9,5% | € 1.85 | -2,0% |
| 9 (-) | Chrysanthemum (Ind Grp) G | 1,3% | 0,5% | € 0.51 | 0,8% |
| 10 (+1) | Limonium | -0,3% | -5,4% | € 0.26 | 5,4% |
Houseplants: differences between product groups continue to widen
Within the houseplant market, the differences between product groups remain significant. Potted moth orchids, by far the largest product group, performed largely as anticipated. Volume growth remained limited, but pricing came under clear pressure throughout the quarter. As a result, revenue fell by 6.4 per cent, whilst the number of units sold remained virtually unchanged from last year.
The picture was more positive for potted roses, where both volume and revenue grew compared with last year. The flamingo flower also showed stable performance, with volumes and prices remaining virtually unchanged. Within the green houseplant sector, a trend that has been evident for several years is continuing. The volume produced and traded is declining further, with the sharpest fall continuing to be seen in the smaller pot sizes. At the same time, we are seeing a cautious recovery in pricing in 2026, suggesting that supply and demand are slowly returning to a more balanced state.
| Position Q2-2026 | Houseplants | Change in revenue (%) | Change in units sold (%) | Average price Q2 '26 (€) | Change in average price Q2 '26 (%) |
|---|---|---|---|---|---|
| 1 (-) | Phalaenopsis | -6,4% | -0,2% | € 4.49 | -6,2% |
| 2 (-) | Rosa | 4,2% | 6,5% | € 1.50 | -2,2% |
| 3 (-) | Kalanchoe | -17,0% | -12,6% | € 0.80 | -5,1% |
| 4 (-) | Hydrangea | -5,4% | -3,9% | € 3.66 | -1,5% |
| 5 (+1) | Anthurium | 0,1% | -0,3% | € 3.61 | 0,4% |
| 6 (-1) | Arrangementen | -20,5% | -30,3% | € 4.64 | 14,0% |
| 7 (+1) | Overig kamerplanten | 24,4% | 17,6% | € 1.89 | 5,8% |
| 8 (-1) | Zantedeschia | -16,0% | -10,5% | € 2.57 | -6,1% |
| 9 (-) | Spathiphyllum | -0,8% | -5,6% | € 1.71 | 5,0% |
| 10 (+1) | Ficus | 3,4% | -4,3% | € 4.75 | 8,0% |
Garden plants: consumers continue to invest in their gardens
For garden plants, the figures paint a slightly more positive picture than for cut flowers and houseplants. Although sales volumes here were also lower than last year, pricing held up relatively well. Over the second quarter, volume fell by 6.0%, whilst the Average Selling Price (ASP) rose by almost 6%. This makes garden plants one of the product groups with the strongest price performance in the second quarter.
One possible explanation is that consumers continue to invest in their homes and gardens even during economic uncertainty. As a result, demand for garden plants remains relatively stable, despite potentially more cautious spending patterns in other parts of the consumer market.
Within the garden plants category, Lavandula and Hydrangea stood out. Lavandula showed growth in both volume and product revenues, supported by a higher Average Selling Price (ASP). Hydrangea also maintained its product revenues thanks to improved pricing.
| Position Q2-2026 | Garden plants | Change in revenue (%) | Change in units sold (%) | Average price Q2 '26 (€) | Change in average price Q2 '26 (%) |
|---|---|---|---|---|---|
| 1 (-) | Lavandula | 14,5% | 6,5% | € 1.86 | 7,5% |
| 2 (-) | Hydrangea | 1,3% | -1,7% | € 5.51 | 3,1% |
| 3 (-) | Overig perkplanten | -10,0% | -13,5% | € 1.54 | 4,0% |
| 4 (-) | Dianthus | -5,9% | -9,3% | € 0.96 | 3,8% |
| 5 (-) | Mandevilla | -3,2% | -1,6% | € 4.55 | -1,6% |
| 6 (-) | Osteospermum | -3,0% | -4,6% | € 0.86 | 1,7% |
| 7 (+3) | Overig bomen/heesters/klp | 2,6% | 6,9% | € 5.66 | -4,1% |
| 8 (-1) | Pelargonium | -6,1% | -15,0% | € 0.82 | 10,4% |
| 9 (-1) | Groenteplanten | -7,4% | -10,6% | € 3.80 | 3,6% |
| 10 (-1) | Overig vaste planten | -16,6% | -13,3% | € 2.02 | -3,8% |
International supply remains under pressure
A more cautious market outlook was also evident internationally. Supplies from key countries of origin, such as Kenya and Ethiopia, were lower than a year ago. In particular, both volume and product revenues from Kenya declined significantly. This was offset by growth from countries such as Spain and Israel.
Mother’s Day
Mother’s Day is the most important floral occasion of the second quarter. A bouquet of flowers is traditionally a popular gift on Mother’s Day, both in the Netherlands and abroad. This is also evident this year from Royal FloraHolland’s sales figures for the week leading up to Mother’s Day.
In the run-up to Mother’s Day 2026, from Monday 4 May to Wednesday 6 May, 154 million flowers were traded (2025: 155 million) and approximately 26 million houseplants and garden plants (2025: 24 million).
| Q2 2026 | Change in revenue (%) | Change in units sold (%) |
|---|---|---|
| National | -2,5% | -3,3% |
| International | -3,8% | -7,3% |
| Top 5 countries of origin | Change in product revenues (%) | Change in units sold (%) |
|---|---|---|
| Kenya | -11,1% | -14,2% |
| Ethiopia | -1,9% | -3,6% |
| Italy | -2,9% | -9,1% |
| Israel | 7,1% | 0,0% |
| Spain | 35,2% | 25,3% |
Finally, here are the financial key figures for the first half of 2026 compared with 2025.
| H1 2026 | Change (%) |
|---|---|
| Revenue | -1,2% |
| Units sold | -0,8% |
| Price – Flowers | -0,9% |
| Price – Plants | +0,6% |
| Volume – units | H1 '26 |
|---|---|
| Auction | 49% |
| Direct | 51% |
-
Did you find this interesting?
Then share this article
-
Related articles